Profiling ClickHouse with LLVM's XRay
Types of profilers
LLVM already includes a tool that instruments the code that allows us to do instrumentation profiling. As opposed to sampling or statistical profiling, it's very precise without losing any calls, at the expense of needing to instrument the code and be more resource expensive.
In a few words, an instrumentation profiler introduces new code to track the call to all functions. Statistical profilers allow us to run the code without requiring any changes, taking snapshots periodically to see the state of the application. So, only the functions running while the snapshot is taken are considered. perf is a very well-known statistical profiler.
How to profile with XRay
Instrument the code
Imagine the following souce code:
#include <chrono>
#include <cstdio>
#include <thread>

void one()
{
    std::this_thread::sleep_for(std::chrono::milliseconds(10));
}

void two()
{
    std::this_thread::sleep_for(std::chrono::milliseconds(5));
}

int main()
{
    printf("Start\n");

    for (int i = 0; i < 10; ++i)
    {
        one();
        two();
    }

    printf("Finish\n");
}
In order to instrument with XRay, we need to add some flags like so:
clang++ -o test test.cpp -fxray-instrument -fxray-instruction-threshold=1
-fxray-instrumentis needed to instrument the code.-fxray-instruction-threshold=1is used so that it instruments all functions, even if they're very small as in our example. By default, it instruments functions with at least 200 instructions.
We can ensure the code has been instrumented correctly by checking there's a new section in the binary:
objdump -h -j xray_instr_map test

test:     file format elf64-x86-64

Sections:
Idx Name          Size      VMA               LMA               File off  Algn
 17 xray_instr_map 000005c0  000000000002f91c  000000000002f91c  0002f91c  2**0
                  CONTENTS, ALLOC, LOAD, READONLY, DATA
Run the process with proper env var values to collect the trace
By default, there is no profiler collection unless explicitly asked for. In other words, unless
we're profiling the overhead is negligible. We can set different values for XRAY_OPTIONS to
configure when the profiler starts collecting and how it does so.
XRAY_OPTIONS="patch_premain=true xray_mode=xray-basic verbosity=1" ./test
==74394==XRay: Log file in 'xray-log.test.14imlN'
Start
Finish
==74394==Cleaned up log for TID: 74394
Convert the trace
XRAy's traces can be converted to several formats. The trace_event format is very useful because
it's easy to parse and there are already a number of tools that support it, so we'll use that one:
llvm-xray convert --symbolize --instr_map=./test --output-format=trace_event xray-log.test.14imlN | gzip > test-trace.txt.gz
Visualize the trace
We can use web-based UIs like speedscope.app or Perfetto.
While Perfetto makes visualizing multiple threads and querying the data easier, speedscope is better generating a flamegraph and a sandwich view of your data.
Time Order

Left Heavy

Sandwitch

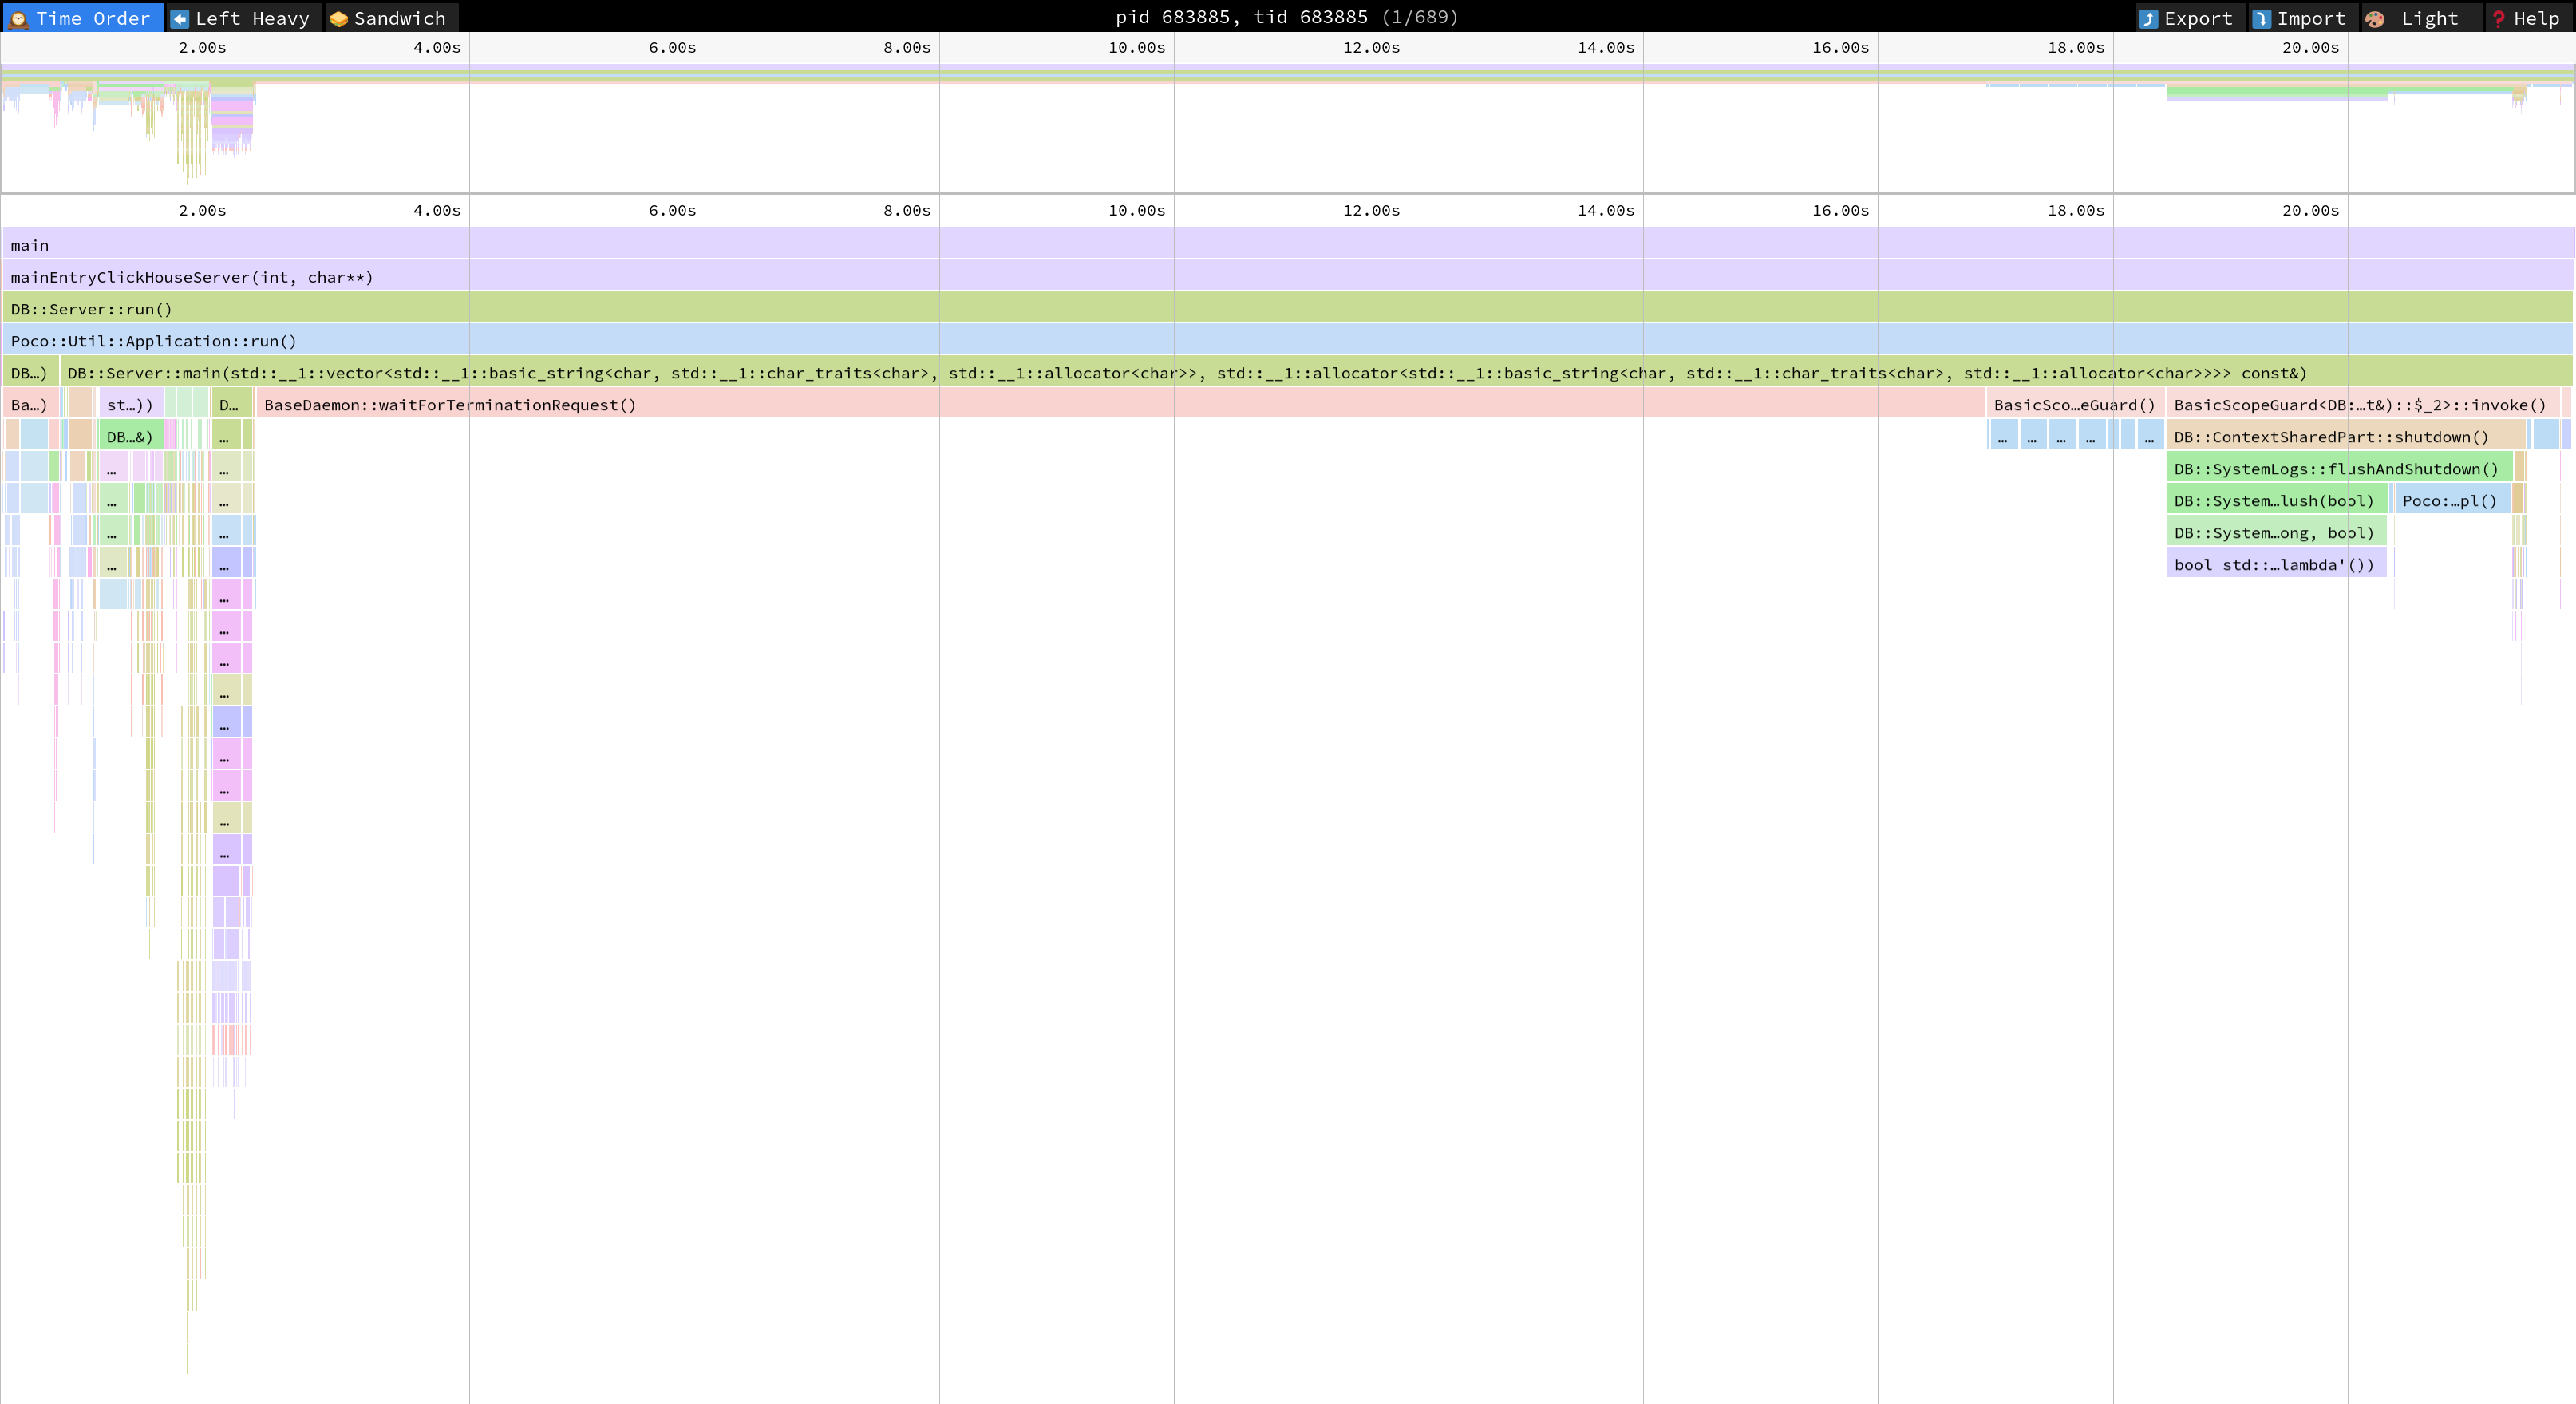
Profiling ClickHouse
- Pass
-DENABLE_XRAY=1tocmakewhen building ClickHouse. This sets the proper compiler flags. - Set
XRAY_OPTIONS="patch_premain=true xray_mode=xray-basic verbosity=1"env var when running ClickHouse to generate the trace. - Convert the trace to an interesting format such as trace event:
llvm-xray convert --symbolize --instr_map=./build/programs/clickhouse --output-format=trace_event xray-log.clickhouse.ZqKprE | gzip > clickhouse-trace.txt.gz. - Visualize the trace in speedscope.app or Perfetto.

Notice that this is the visualization of only one thread. You can select the others tids on the
top bar.
Check out the docs
Take a look at the XRay Instrumentation and Debugging with XRay documentation to learn more details.