Using Grafana and ClickHouse for Observability
Grafana represents the preferred visualization tool for Observability data in ClickHouse. This is achieved using the official ClickHouse plugin for Grafana. Users can follow the installation instructions found here.
V4 of the plugin makes logs and traces a first-class citizen in a new query builder experience. This minimizes the need for SREs to write SQL queries and simplifies SQL-based Observability, moving the needle forward for this emerging paradigm. Part of this has been placing Open Telemetry (OTel) at the core of the plugin, as we believe this will be the foundation of SQL-based Observability over the coming years and how data will be collected.
Open Telemetry Integration
On configuring a Clickhouse datasource in Grafana, the plugin allows the users to specify a default database and table for logs and traces and whether these tables conform to the OTel schema. This allows the plugin to return the columns required for correct log and trace rendering in Grafana. If you've made changes to the default OTel schema and prefer to use your own column names, these can be specified. Usage of the default OTel column names for columns such as time (Timestamp), log level (SeverityText), or message body (Body) means no changes need to be made.
Users can connect Grafana to ClickHouse over either the HTTP or Native protocol. The latter offers marginal performance advantages which are unlikely to be appreciable in the aggregation queries issued by Grafana users. Conversely, the HTTP protocol is typically simpler for users to proxy and introspect.
The Logs configuration requires a time, log level, and message column in order for logs to be rendered correctly.
The Traces configuration is slightly more complex (full list here). The required columns here are needed such that subsequent queries, which build a full trace profile, can be abstracted. These queries assume data is structured similarly to OTel, so users deviating significantly from the standard schema will need to use views to benefit from this feature.
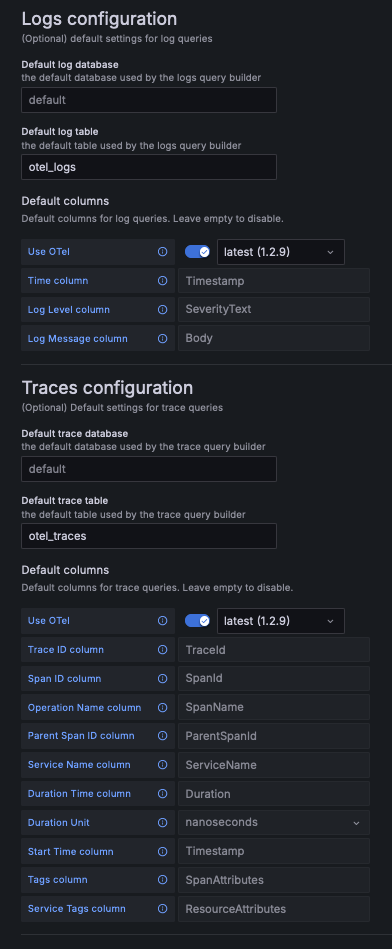
Once configured users can navigate to Grafana Explore and begin searching logs and traces.
Logs
If adhering to the Grafana requirements for logs, users can select Query Type: Log in the query builder and click Run Query. The query builder will formulate a query to list the logs and ensure they are rendered e.g.
SELECT Timestamp as timestamp, Body as body, SeverityText as level, TraceId as traceID FROM "default"."otel_logs" WHERE ( timestamp >= $__fromTime AND timestamp <= $__toTime ) ORDER BY timestamp DESC LIMIT 1000
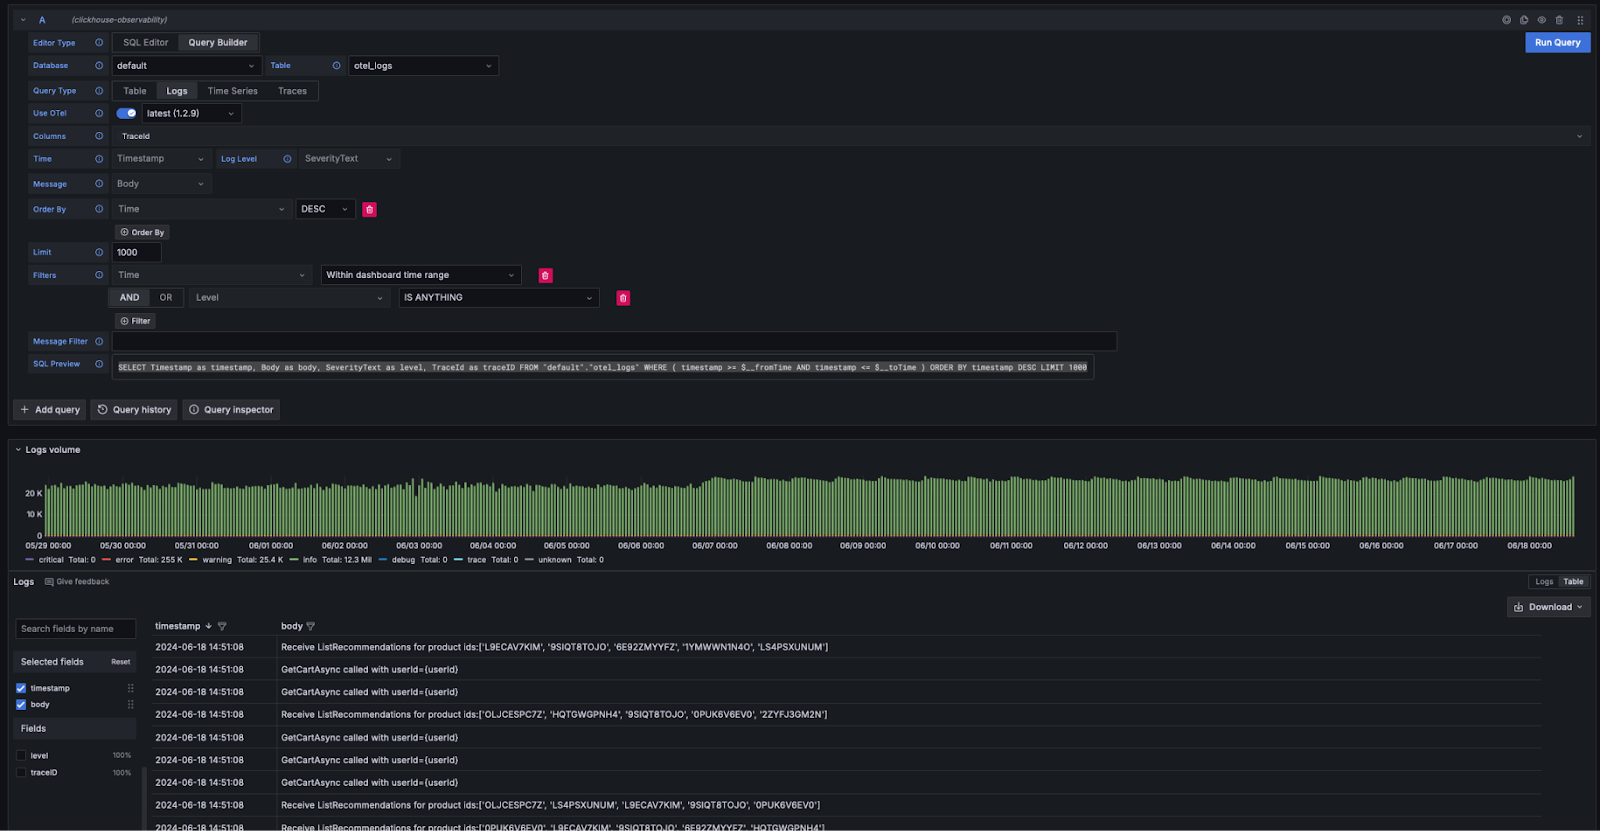
The query builder provides a simple means of modifying the query, avoiding the need for users to write SQL. Filtering, including finding logs containing keywords, can be performed from the query builder. Users wishing to write more complex queries can switch to the SQL editor. Provided the appropriate columns are returned, and logs selected as the Query Type, the results will be rendered as logs. The required columns for log rendering are listed here.
Logs to traces
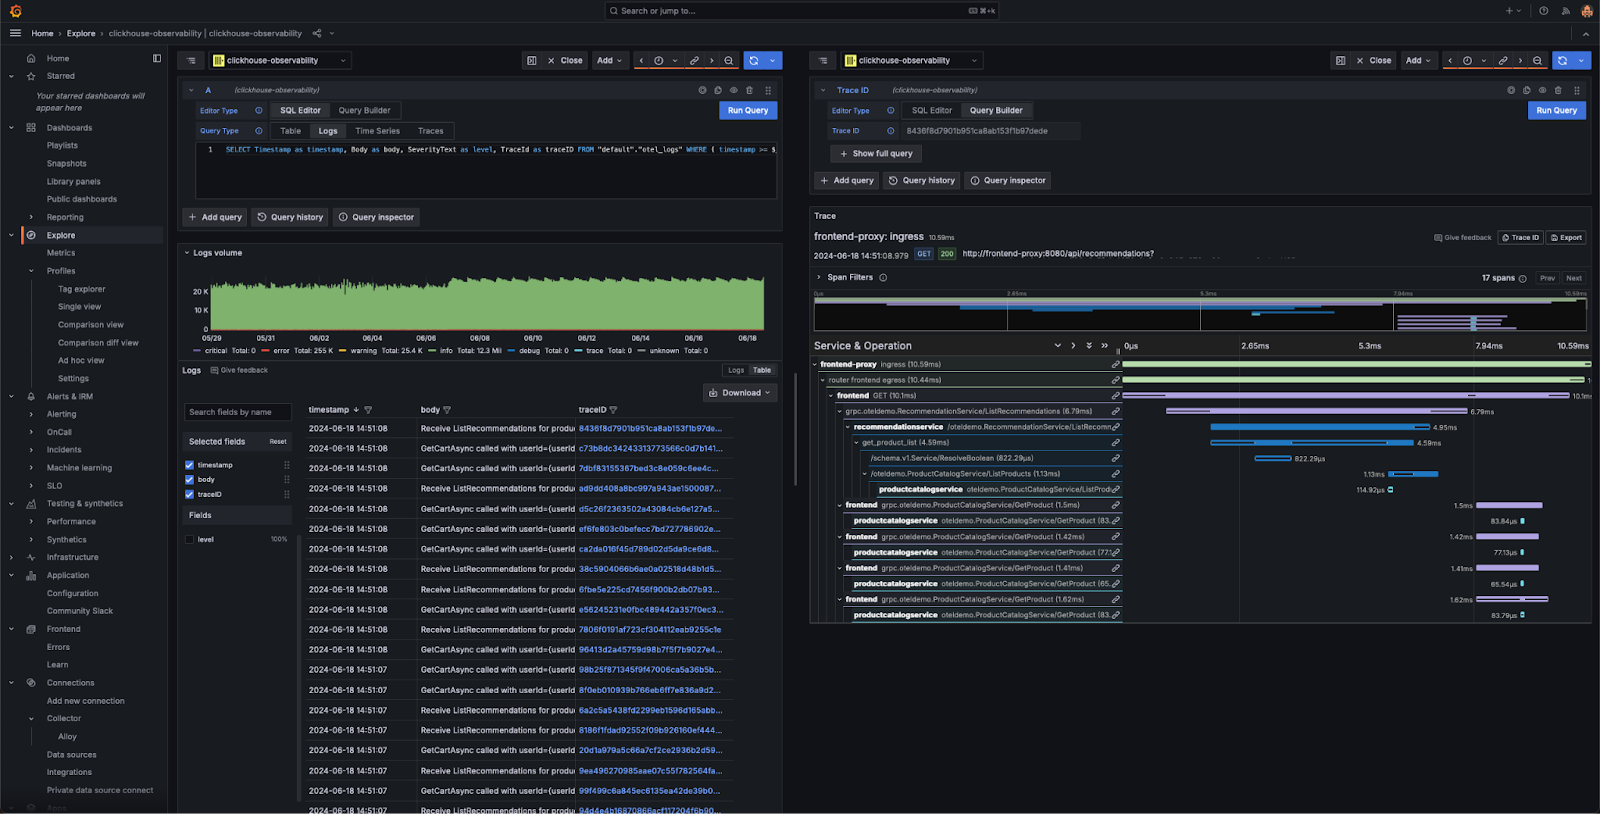
If logs contain trace Ids, users can benefit from being able to navigate through to a trace for a specific log line.
Traces
Similar to the above logging experience, if the columns required by Grafana to render traces are satisfied (e.g., by using the OTel schema), the query builder is able to automatically formulate the necessary queries. By selecting Query Type: Traces and clicking Run Query, a query similar to the following will be generated and executed (depending on your configured columns - the following assumes the use of OTel):
SELECT "TraceId" as traceID,
  "ServiceName" as serviceName,
  "SpanName" as operationName,
  "Timestamp" as startTime,
  multiply("Duration", 0.000001) as duration
FROM "default"."otel_traces"
WHERE ( Timestamp >= $__fromTime AND Timestamp <= $__toTime )
  AND ( ParentSpanId = '' )
  AND ( Duration > 0 )
  ORDER BY Timestamp DESC, Duration DESC LIMIT 1000
This query returns the column names expected by Grafana, rendering a table of traces as shown below. Filtering on duration or other columns can be performed without needing to write SQL.
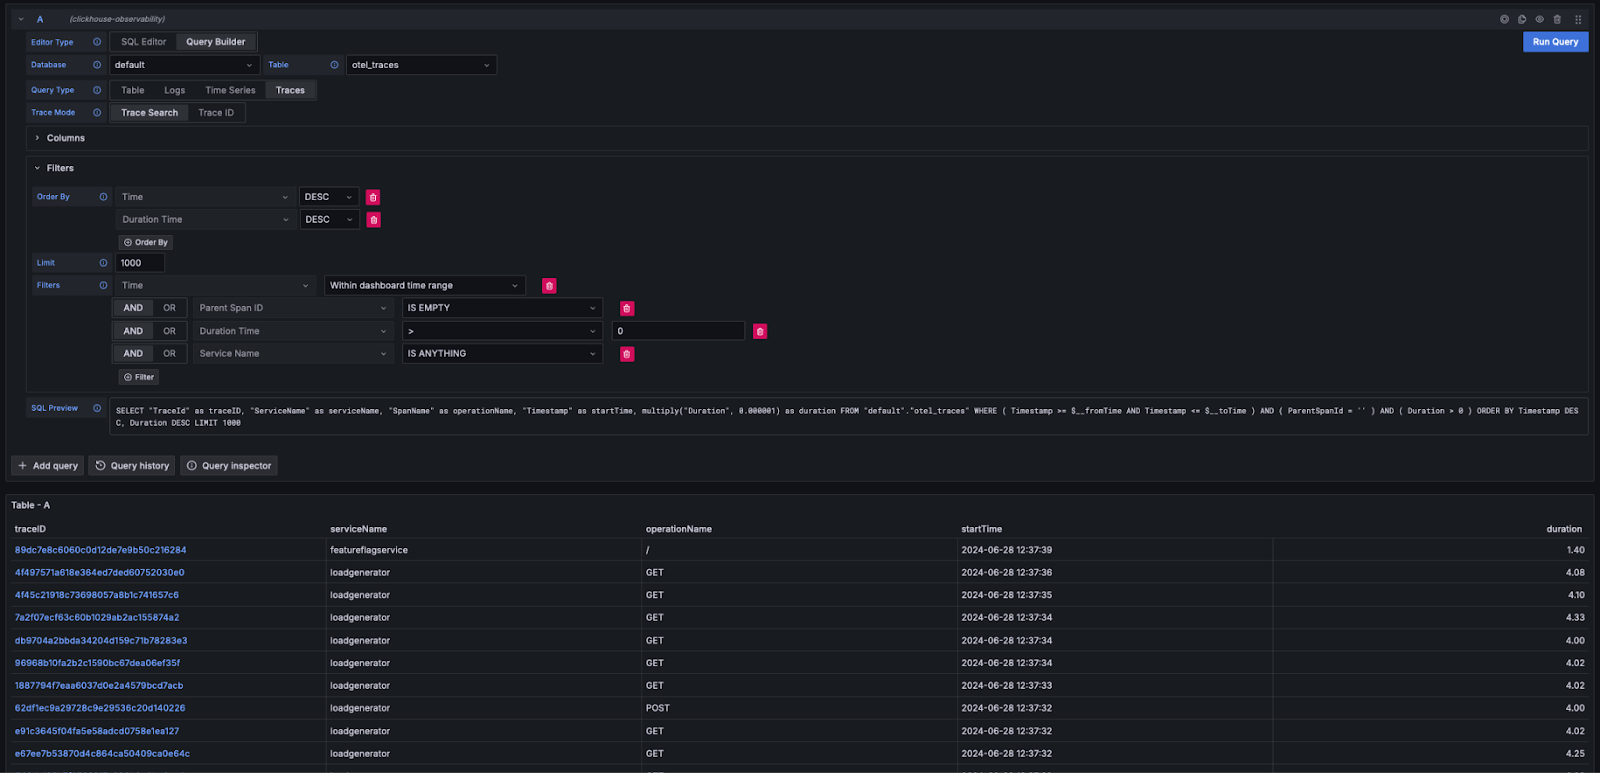
Users wishing to write more complex queries can switch to the SQL Editor.
View Trace details
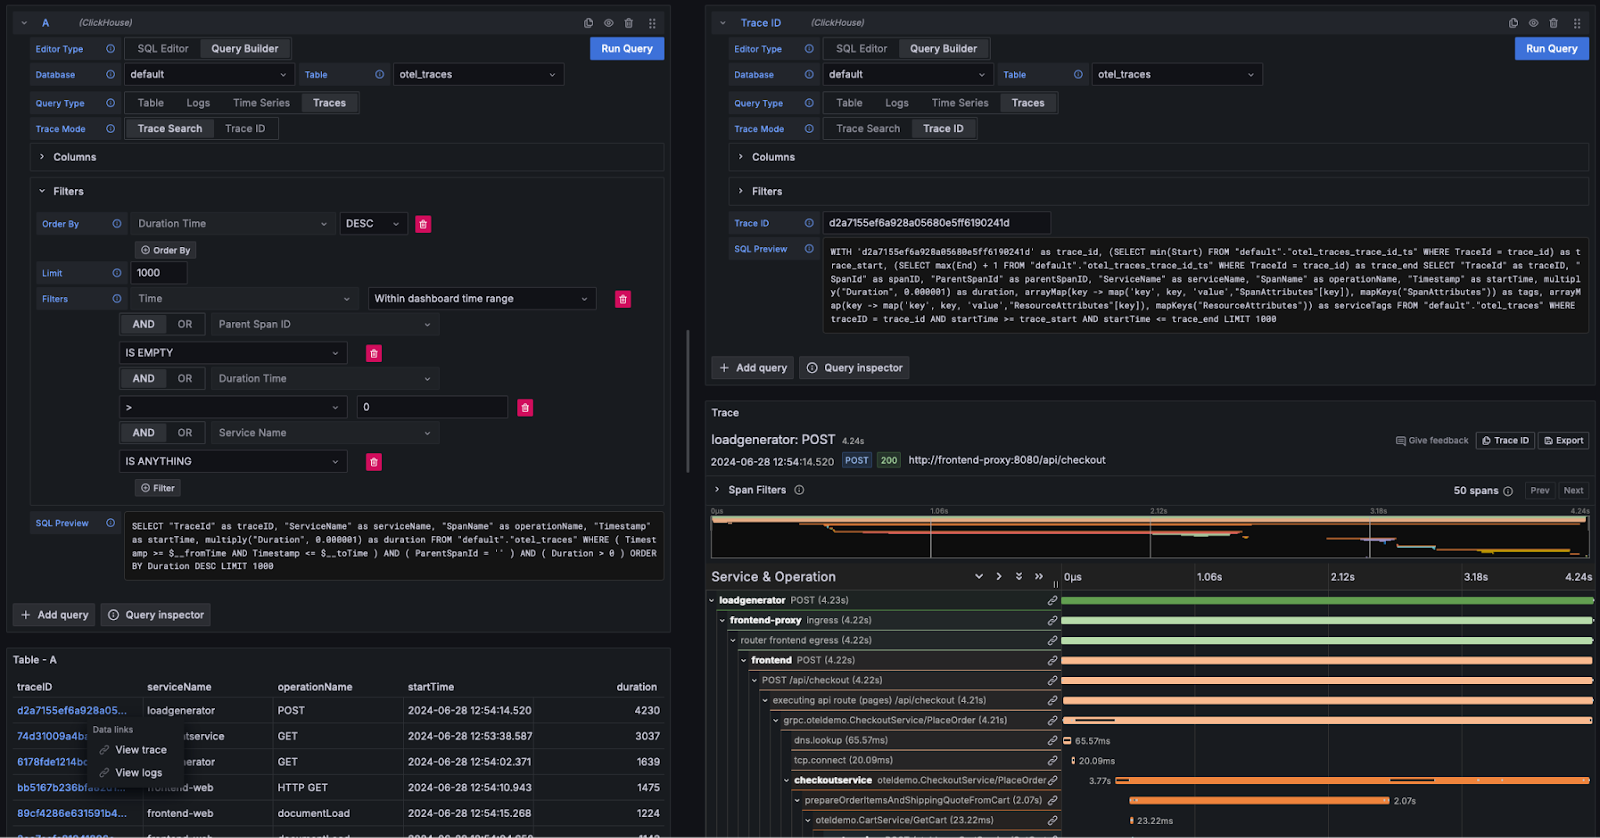
As shown above, Trace ids are rendered as clickable links. On clicking on a trace Id, a user can choose to view the associated spans via the link View Trace. This issues the following query (assuming OTel columns) to retrieve the spans in the required structure, rendering the results as a waterfall.
WITH '<trace_id>' as trace_id,
  (SELECT min(Start) FROM "default"."otel_traces_trace_id_ts"
    WHERE TraceId = trace_id) as trace_start,
  (SELECT max(End) + 1 FROM "default"."otel_traces_trace_id_ts"
    WHERE TraceId = trace_id) as trace_end
SELECT "TraceId" as traceID,
  "SpanId" as spanID,
  "ParentSpanId" as parentSpanID,
  "ServiceName" as serviceName,
  "SpanName" as operationName,
  "Timestamp" as startTime,
  multiply("Duration", 0.000001) as duration,
  arrayMap(key -> map('key', key, 'value',"SpanAttributes"[key]),
  mapKeys("SpanAttributes")) as tags,
  arrayMap(key -> map('key', key, 'value',"ResourceAttributes"[key]),
  mapKeys("ResourceAttributes")) as serviceTags
FROM "default"."otel_traces"
WHERE traceID = trace_id
  AND startTime >= trace_start
  AND startTime <= trace_end
LIMIT 1000
Note how the above query uses the materialized view otel_traces_trace_id_ts to perform the trace id lookup. See Accelerating Queries - Using Materialized views for lookups for further details.
Traces to logs
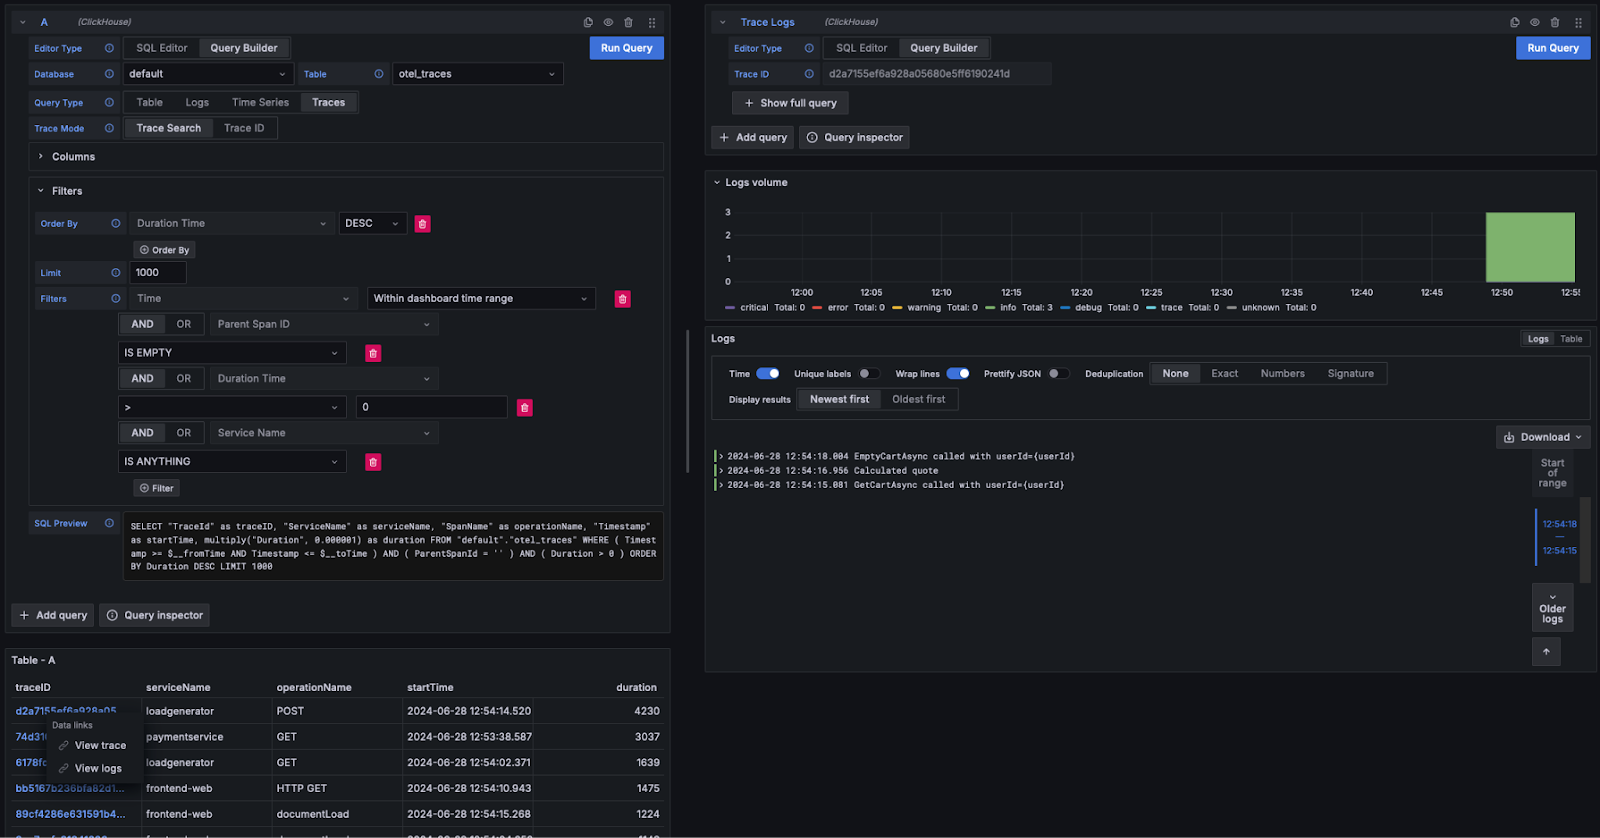
If logs contain trace ids, users can navigate from a trace to its associated logs. To view the logs click on a trace id and select View Logs. This issues the following query assuming default OTel columns.
SELECT Timestamp as "timestamp",
  Body as "body", SeverityText as "level",
  TraceId as "traceID" FROM "default"."otel_logs"
WHERE ( traceID = '<trace_id>' )
ORDER BY timestamp ASC LIMIT 1000
Dashboards
Users can build dashboards in Grafana using the ClickHouse data source. We recommend the Grafana and ClickHouse data source documentation for further details, especially the concept of macros and variables.
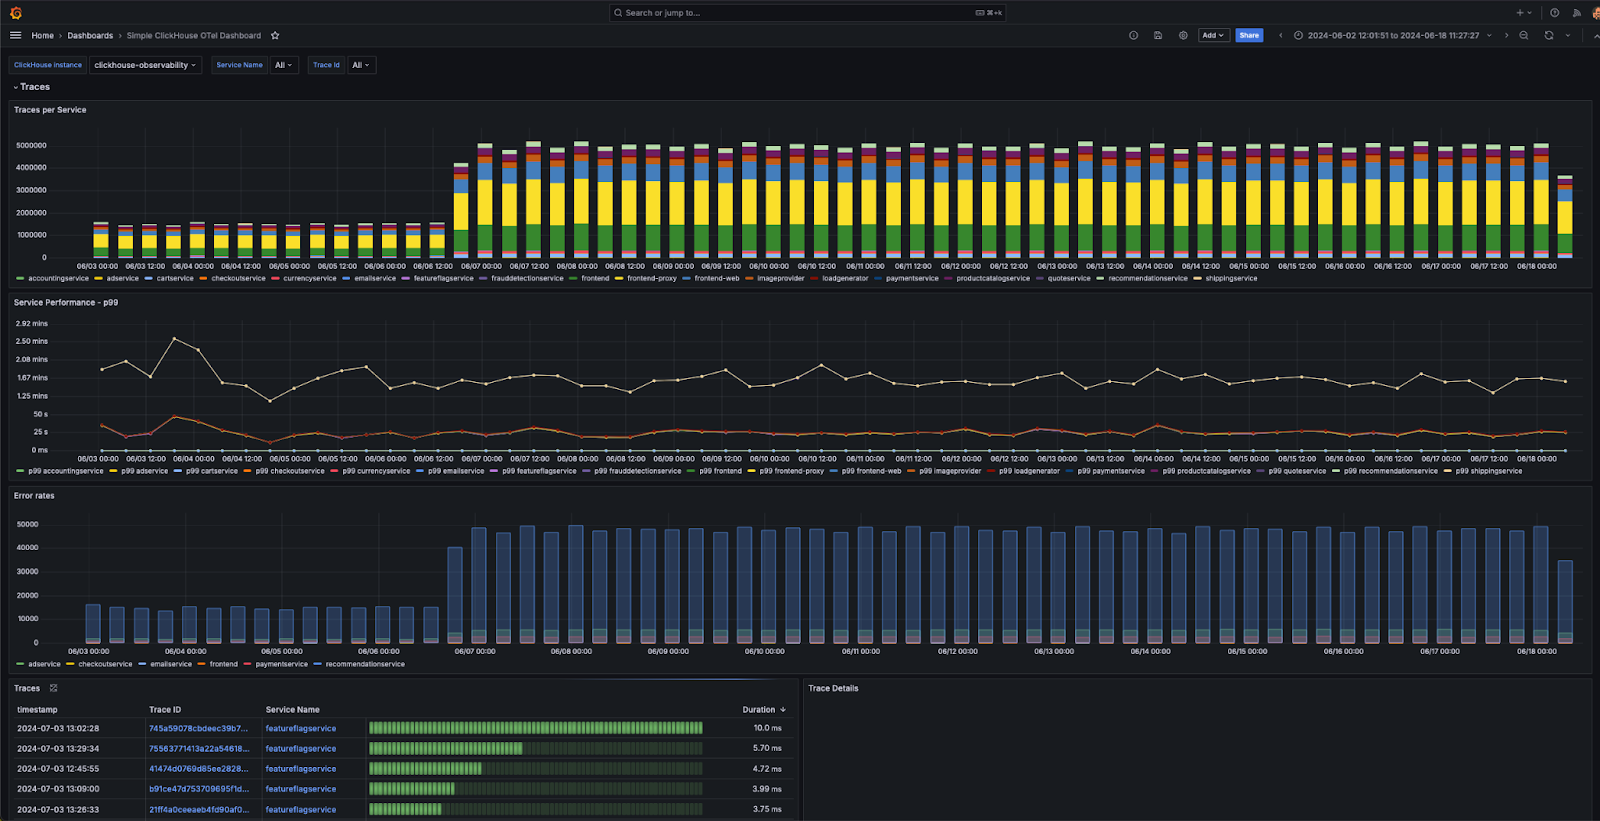
The plugin provides several out-of-the-box dashboards, including an example dashboard, "Simple ClickHouse OTel dashboarding," for logging and tracing data conforming to the OTel specification. This requires users to conform to the default column names for OTel and can be installed from the data source configuration.
We provide some simple tips for building visualizations below.
Time series
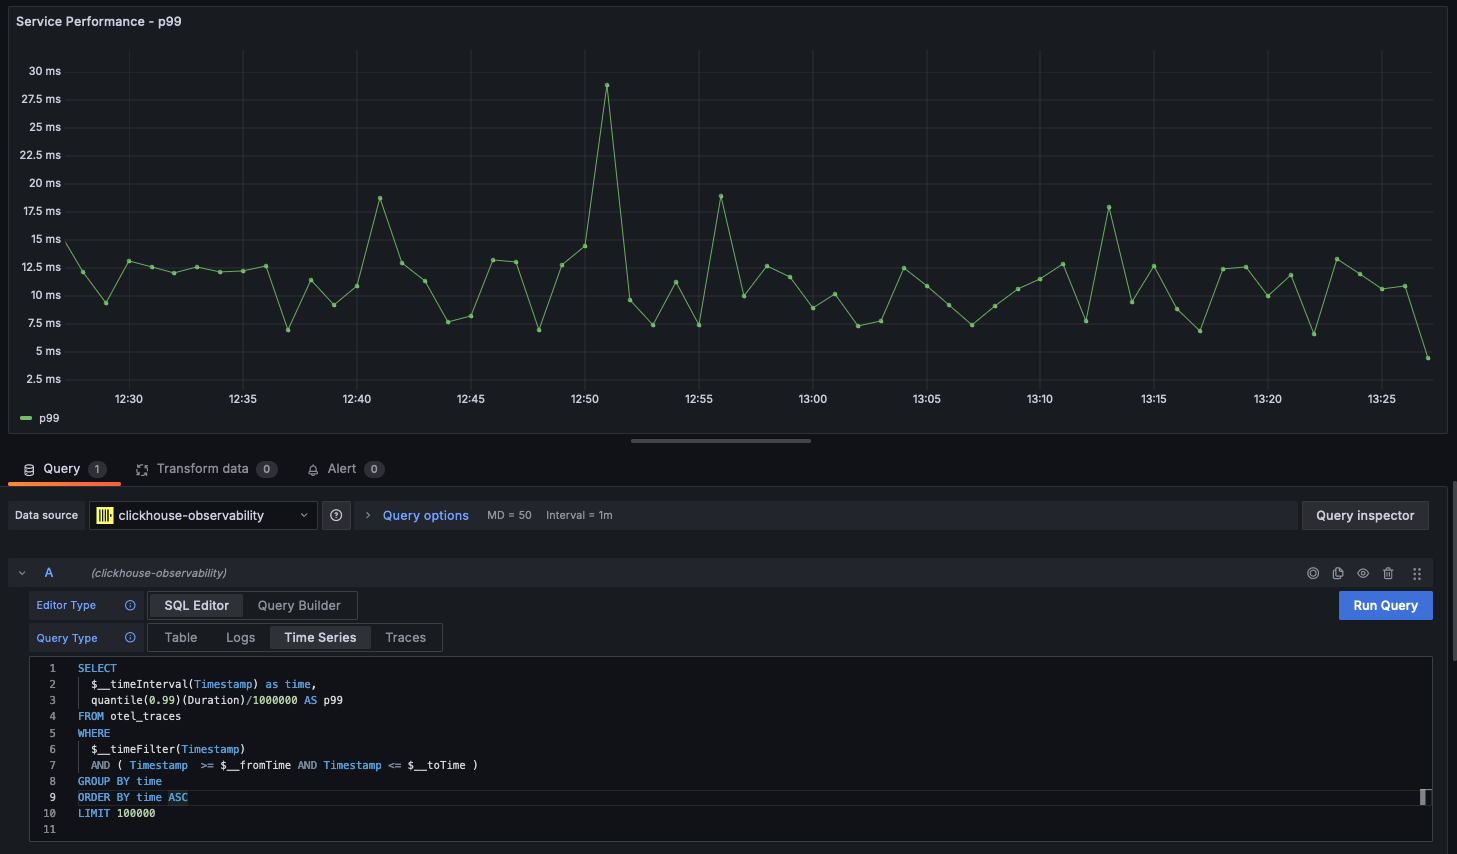
Along with statistics, line charts are the most common form of visualization used in observability use cases. The Clickhouse plugin will automatically render a line chart if a query returns a datetime named time and a numeric column. For example:
SELECT
 $__timeInterval(Timestamp) as time,
 quantile(0.99)(Duration)/1000000 AS p99
FROM otel_traces
WHERE
 $__timeFilter(Timestamp)
 AND ( Timestamp  >= $__fromTime AND Timestamp <= $__toTime )
GROUP BY time
ORDER BY time ASC
LIMIT 100000
Multi-line charts
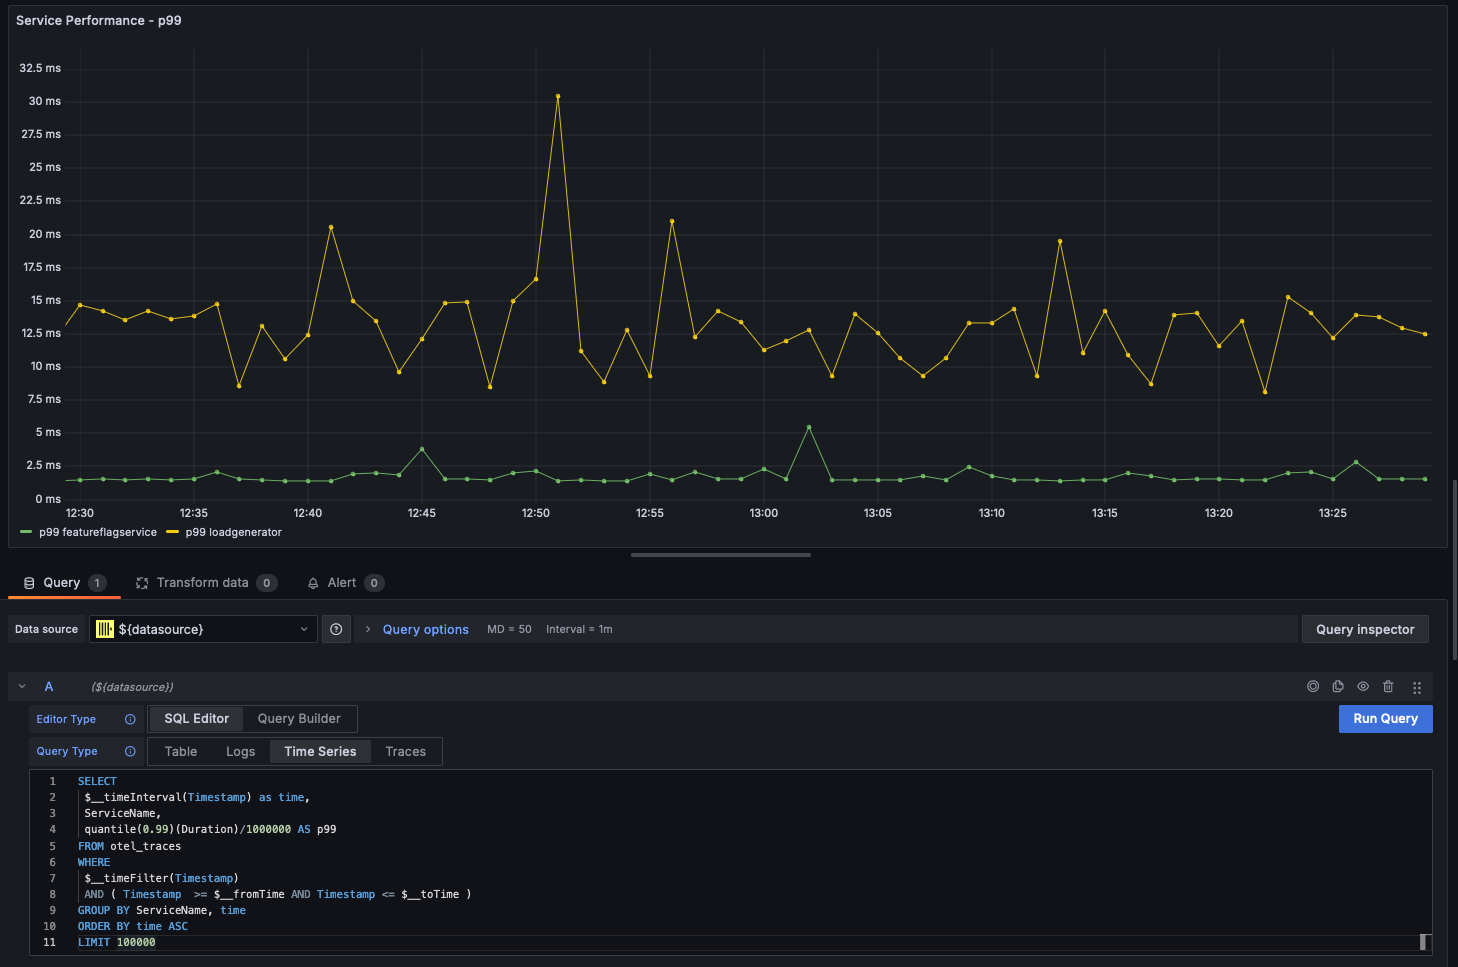
Multi-line charts will be automatically rendered for a query provided the following conditions are met:
- field 1: datetime field with an alias of time
- field 2: value to group by. This should be a String.
- field 3+: the metric values
For example:
SELECT
  $__timeInterval(Timestamp) as time,
  ServiceName,
  quantile(0.99)(Duration)/1000000 AS p99
FROM otel_traces
WHERE $__timeFilter(Timestamp)
AND ( Timestamp  >= $__fromTime AND Timestamp <= $__toTime )
GROUP BY ServiceName, time
ORDER BY time ASC
LIMIT 100000
Visualizing geo data
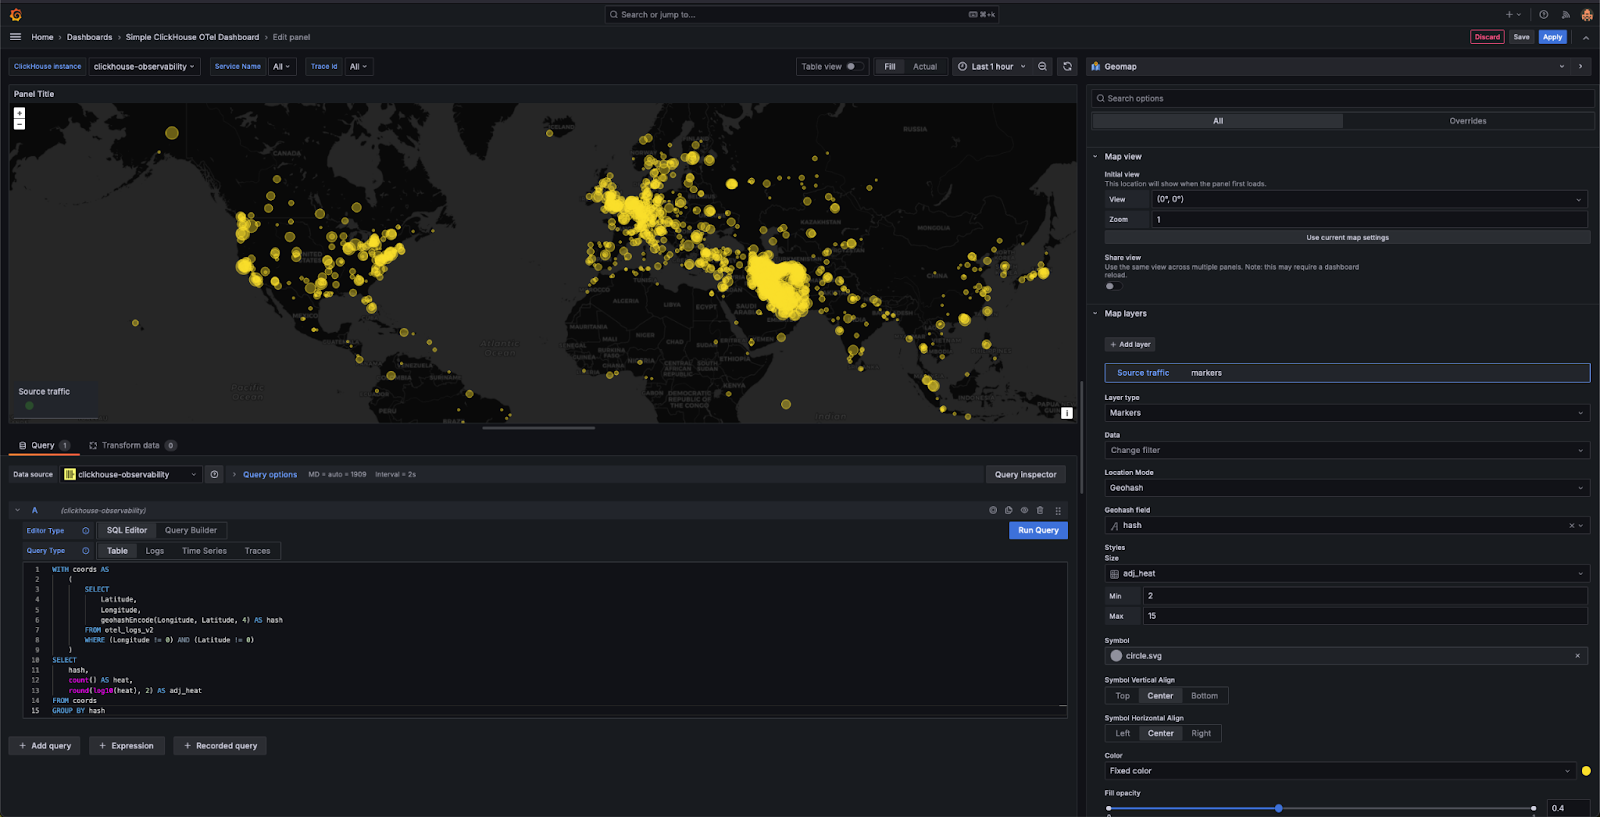
We have explored enriching observability data with geo coordinates using IP dictionaries in earlier sections. Assuming you have latitude and longitude columns, observability can be visualized using the geohashEncode function. This produces geo hashes compatible with Grafana's Geo Map chart. An example query and visualization are shown below:
WITH coords AS
	(
    	SELECT
        	Latitude,
        	Longitude,
        	geohashEncode(Longitude, Latitude, 4) AS hash
    	FROM otel_logs_v2
    	WHERE (Longitude != 0) AND (Latitude != 0)
	)
SELECT
	hash,
	count() AS heat,
	round(log10(heat), 2) AS adj_heat
FROM coords
GROUP BY hash
